
Have you ever wondered if a list of companies can really capture what’s happening in the global economy? The MSCI World Index follows over 1,500 large and mid-sized companies in 23 developed countries. This means it covers about 85% of all market activity. It mixes sectors like tech, healthcare, and finance, giving us a clear snapshot of strong, mature economies.
In this article, you'll see how this index works as a useful guide for investors looking for bold global growth.
msci world index: Bold Global Growth

The MSCI World Index stands as a top measure for global investments. It tracks over 1,500 big and mid-sized companies from 23 developed countries across North America, Europe, and the Asia-Pacific. This means it covers about 85 percent of the total market value in these nations, giving a clear picture of mature economies.
Started in 1969, the index gets updated periodically to reflect changes in these markets. Investors like it for its mix of sectors such as technology, healthcare, financials, and consumer goods. Imagine having a portfolio as diverse as a restaurant menu, from innovative tech companies to trusted healthcare providers. This spread helps lower risk by not putting all your eggs in one basket.
Because of its wide country and sector reach, the MSCI World Index is a handy tool for anyone keen on global stock markets. It shows real-time moves of established companies and offers clues about big economic trends that can affect your returns. Before diving into complex models, many investors rely on straightforward benchmarks like this one to gauge market performance.
In uncertain economic times, this index serves as a trusted signal of market health, making investment decisions a bit simpler.
Methodology and Calculation of the MSCI World Index
The index is built using a free float market capitalization method. This means we only consider the shares that are available for public trading. Companies with more shares on the market will move the index more because more people can invest in them. For example, a well-known tech company with almost all its shares in public hands will have a bigger impact than a firm where many shares are held by insiders.
Every quarter, the index is reviewed to make sure it reflects today’s market conditions. Regular checks on market data help us spot changes in company performance or shifts in industry sectors. Then, every six months, we rebalance the index to adjust the weights based on available market trading shares. This ongoing update keeps the numbers fresh and accurate.
This careful process helps investors see moves that come from real economic changes rather than random ups and downs. By keeping the index adjusted and supported by clear data, it remains a reliable tool for understanding global investment trends and making informed asset allocation decisions.
MSCI World Index Constituents and Country Exposure

The MSCI World Index gathers 1,325 established companies as of 30 June 2025. It gives us a clear snapshot of equity markets in developed countries. The index uses free float market capitalization to show where the biggest companies are located. In fact, about 65% of its weight comes from the United States, making it the clear leader. Other countries like Japan, the United Kingdom, France, and Canada also contribute important pieces to this global picture. Think of the index as a puzzle where each country's share helps complete the overall image.
When we break down the sectors, tech leads the way with about 23% of the allocation. This shows how important innovative firms are in today’s market. Financials hold around 15%, serving as another key part of the mix. Healthcare makes up roughly 13%, reflecting the growing focus on well-being and research. Meanwhile, consumer goods account for about 12%, covering everyday products. This blend of countries and sectors helps investors spread risk while tapping into exciting growth across global markets.
| Country | Constituents | Weight (%) |
|---|---|---|
| United States | 600+ | 65.0 |
| Japan | 150+ | 6.0 |
| United Kingdom | 100+ | 4.0 |
| France | 80+ | 3.0 |
| Canada | 70+ | 3.0 |
Historical Performance and Return Trends of the MSCI World Index

Since 1969, the MSCI World Index has shown steady performance, returning about 7 percent to 10 percent in U.S. dollars each year. Investors see these numbers as a sign that the market is reliable, even when conditions are tough. It’s a bit like counting on a steady beat in a changing world.
A recent chart, updated on 27 Nov 2025, shows one-year performance in euros for the largest MSCI World ETF. This chart helps us understand recent price moves clearly. When reinvested dividends are counted as part of total returns, investors get a fuller picture of their rewards. Think of it as not just counting your coins but also appreciating the bonuses along the way.
Month-end figures for all ETFs are tracked regularly, which helps analysts compare market performance across different regions. This ongoing review shows a consistent upward trend and reinforces the index’s role as a valuable benchmark. Investors rely on it to see how many companies, together, drive overall market trends.
Looking back at its history, the MSCI World Index shows how diversified portfolios benefit from a balanced mix of risks and rewards across developed markets. These long-term patterns give investors confidence and a clear idea of what to expect from their market exposure.
Investing in the MSCI World Index Through ETFs and Fund Options

Investors usually tap into the MSCI World Index by using index-tracking ETFs. These funds hold a mix of large and mid-cap companies to reflect the overall performance of the index. With annual fees ranging from 0.05% to 0.50%, you get a cost-effective way to spread your investments across global markets. Even when the fee is modest, you still gain broad access to developed regions.
Distributing ETFs send dividends your way, much like receiving a regular paycheck, while accumulating ETFs reinvest those earnings automatically. Imagine getting dividends as little bonuses that boost your portfolio without any extra work. Your choice depends on whether you value instant cash or want your money to compound over time.
Online platforms offer handy tools that let you compare different MSCI World ETFs. These resources include ETF screeners, fund lists sorted by size and cost, and side-by-side comparisons of returns and fees. When choosing a fund, it helps to consider factors like cost, liquidity, and how closely the fund tracks the index. For more guidance, you might check out insights on strategies for global markets.
Easy-to-understand information combined with these online tools makes it simple for even new investors to build a global portfolio anchored by the solid performance of the MSCI World Index.
Live Tracking and Chart Tools for MSCI World Index Data

Real-time charts show you what’s happening with the MSCI World Index as it updates throughout the day. These tools let investors catch quick market shifts so you can notice tiny trends as they form. For example, when a major tech company unveils a breakthrough, the chart captures the market’s reaction in a split second, a bit like watching a live sports game where every moment matters.
Online ETF comparison tools make it really easy to keep track of performance. They update daily with details like current holdings and fund movements, giving investors a clear look at how the market is behaving without having to refresh manually.
There’s also a free backtesting tool by Curvo that lets you check out past ETF performance using historical data. Imagine testing a portfolio like you’re playing a video game simulation: you can see what strategies work and what might need a tweak based on real past trends.
Investors also get the added perk of downloadable datasets for deeper analysis. With quick access to live benchmark data and easy-to-read charts, you can make well-informed decisions in today’s fast-moving market.
Risks and Limitations for MSCI World Index Investors
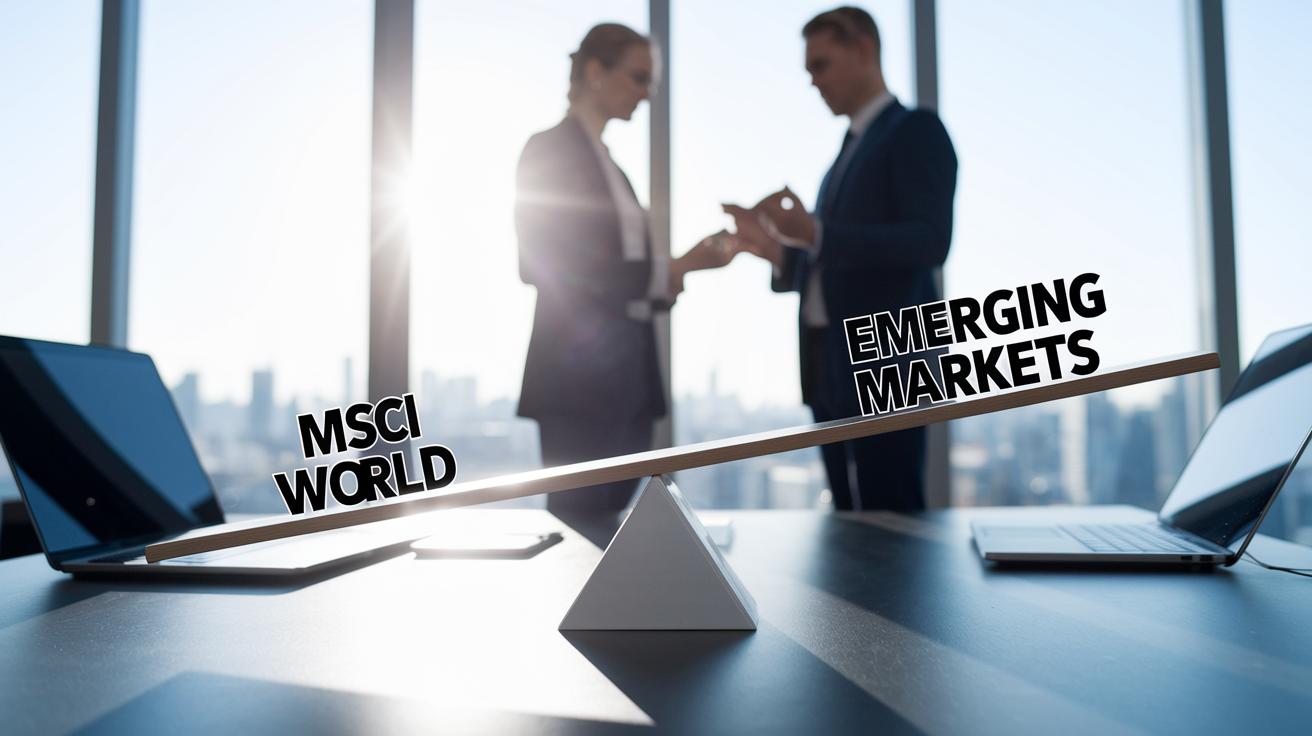
The MSCI World Index leaves out emerging markets like China, India, and Brazil, so you don't get the full picture of global performance. If you stick only with this index, you might miss out on some exciting opportunities from fast-growing markets.
Because the index leans heavily toward big U.S. companies, any big shift in the U.S. market can really change your returns. Think of it like a seesaw where one side carries most of the weight. Imagine riding a roller coaster where one steep drop makes the whole ride feel bumpy.
There are also differences in cost and tax matters depending on whether you choose distributing or accumulating ETFs. Distributing funds pay you cash regularly, similar to getting periodic bonuses, while accumulating funds reinvest that money automatically. This choice can affect both your net returns and the taxes you might owe.
When you consider how much the index can go up and down, it helps to look at measures that show price changes. If you need more details, try searching online for "define market volatility" to see clear examples of this idea.
Balancing these risks means weighing the rewards against the chance of being too heavily exposed to one market. Investors should take their time to think about these factors as a key part of their risk and return analysis.
Final Words
In the action, we traced the msci world index from its core definition and calculation through its diverse global constituents and real-time tracking tools. We examined historic performance, risk factors, and how ETFs offer investors a practical way to engage with the index. The piece broke down technical details into clear examples and comparisons to bring home how these components work together in global investments. It leaves readers with practical insights to remain agile and confident amid ever-changing market trends.
FAQ
Q: What is the MSCI World Index?
A: The MSCI World Index is a global benchmark that tracks over 1,500 large- and mid-cap stocks from 23 developed markets, helping investors gauge overall market performance.
Q: What does MSCI stand for?
A: MSCI stands for Morgan Stanley Capital International, a firm known for creating financial indexes and tools that help investors analyze global stock markets.
Q: What are MSCI World Index ETFs?
A: MSCI World Index ETFs mirror the performance of the index by holding a diversified mix of stocks, offering broad global exposure with varying structures for cost and dividend distribution.
Q: How does the MSCI World Index performance compare?
A: The MSCI World Index performance reflects diverse sectors and countries, historically averaging between 7 and 10 percent annual returns when dividends are reinvested.
Q: How can I access the MSCI World Index price chart and live data?
A: You can access the MSCI World Index price chart and live data on financial platforms that show current index values, historical trends, and allow for real-time market analysis.
Q: How is the MSCI World Index’s historical data compiled?
A: The historical data is compiled by tracking monthly and year-end figures, including reinvested dividends, which provides insights into market trends since the index’s inception in 1969.
Q: What does MSCI World Index YTD mean?
A: MSCI World Index YTD refers to the year-to-date performance of the index, showing the cumulative return from the start of the year to the current date.
Q: What is the difference between the S&P 500 and the MSCI World Index?
A: The S&P 500 focuses solely on 500 large U.S. companies, while the MSCI World Index includes over 1,500 stocks spread across 23 developed countries around the globe.
Q: Are the companies in the MSCI World Index diverse?
A: The companies in the MSCI World Index are diverse, covering a range of sectors like technology, healthcare, and financials from multiple developed markets, which helps reflect global economic trends.
Q: Is an MSCI World-based ETF a good option for investors?
A: An MSCI World-based ETF can be a good option for investors seeking broad international exposure, though reviewing factors such as cost, dividend policy, and tracking performance is essential.
vidalista 2.5 mg tablets
vidalista 2.5 mg tablets
does creon expire
does creon expire
revatio sildenafil
revatio sildenafil
cialis walmart
cialis walmart
ozempic cost costco
ozempic cost costco
metronidazole side effects urine smell
metronidazole side effects urine smell
tadalafil 5mg foto
tadalafil 5mg foto
kirkland minoxidil costco
kirkland minoxidil costco
toradol onset
toradol onset
minoxidil knowledge faq
minoxidil knowledge faq
minoxidil mechanism details
minoxidil mechanism details